
Fabric Unified Admin Monitoring: Part 2
Fabric Unified Admin Monitoring Part 2 of 3
Introduction
In Part I of this blog series, we introduced FUAM and its core principles. Now in Part II, we’ll explore how FUAM collects data, organises it, and delivers insights through its pre-built reports.
How FUAM Works
FUAM extracts the following data from the tenant:
- Tenant Settings
- Delegated Tenant Settings
- Activities
- Workspaces
- Capacities
- Capacity Metrics
- Tenant metadata (Scanner API)
- Capacity Refreshables
- Git Connections
It is also expected that FUAM will support Engine level insights as well in the future.
This data is ingested using pre-built Pipelines and Notebooks, which transform and load it into a unified Lakehouse. The ingestion process is fully orchestrated and parameterized, allowing the main pipeline to handle both initial and incremental data loads. The FUAM Lakehouse serves as a central component of the architecture, where all data is transformed and stored persistently. FUAM follows a Medallion Lakehouse Architecture, organizing data into three layers: Bronze, Silver, and Gold. This structure ensures consistent, reliable data that can be retained as long as needed. Data is stored both in its original raw format and as Delta Parquet, enabling users to access it directly through Power BI using Direct Lake or query it via SQL through the Lakehouse SQL Endpoint.
The FUAM Pre-built Reports
To help users get started quickly, FUAM includes a set of pre-built reports covering monitoring needs from tenant-level summaries down to individual queries. These reports are modular organisations can use them as-is or extend them with custom reporting.
Core and Item-Level Reports
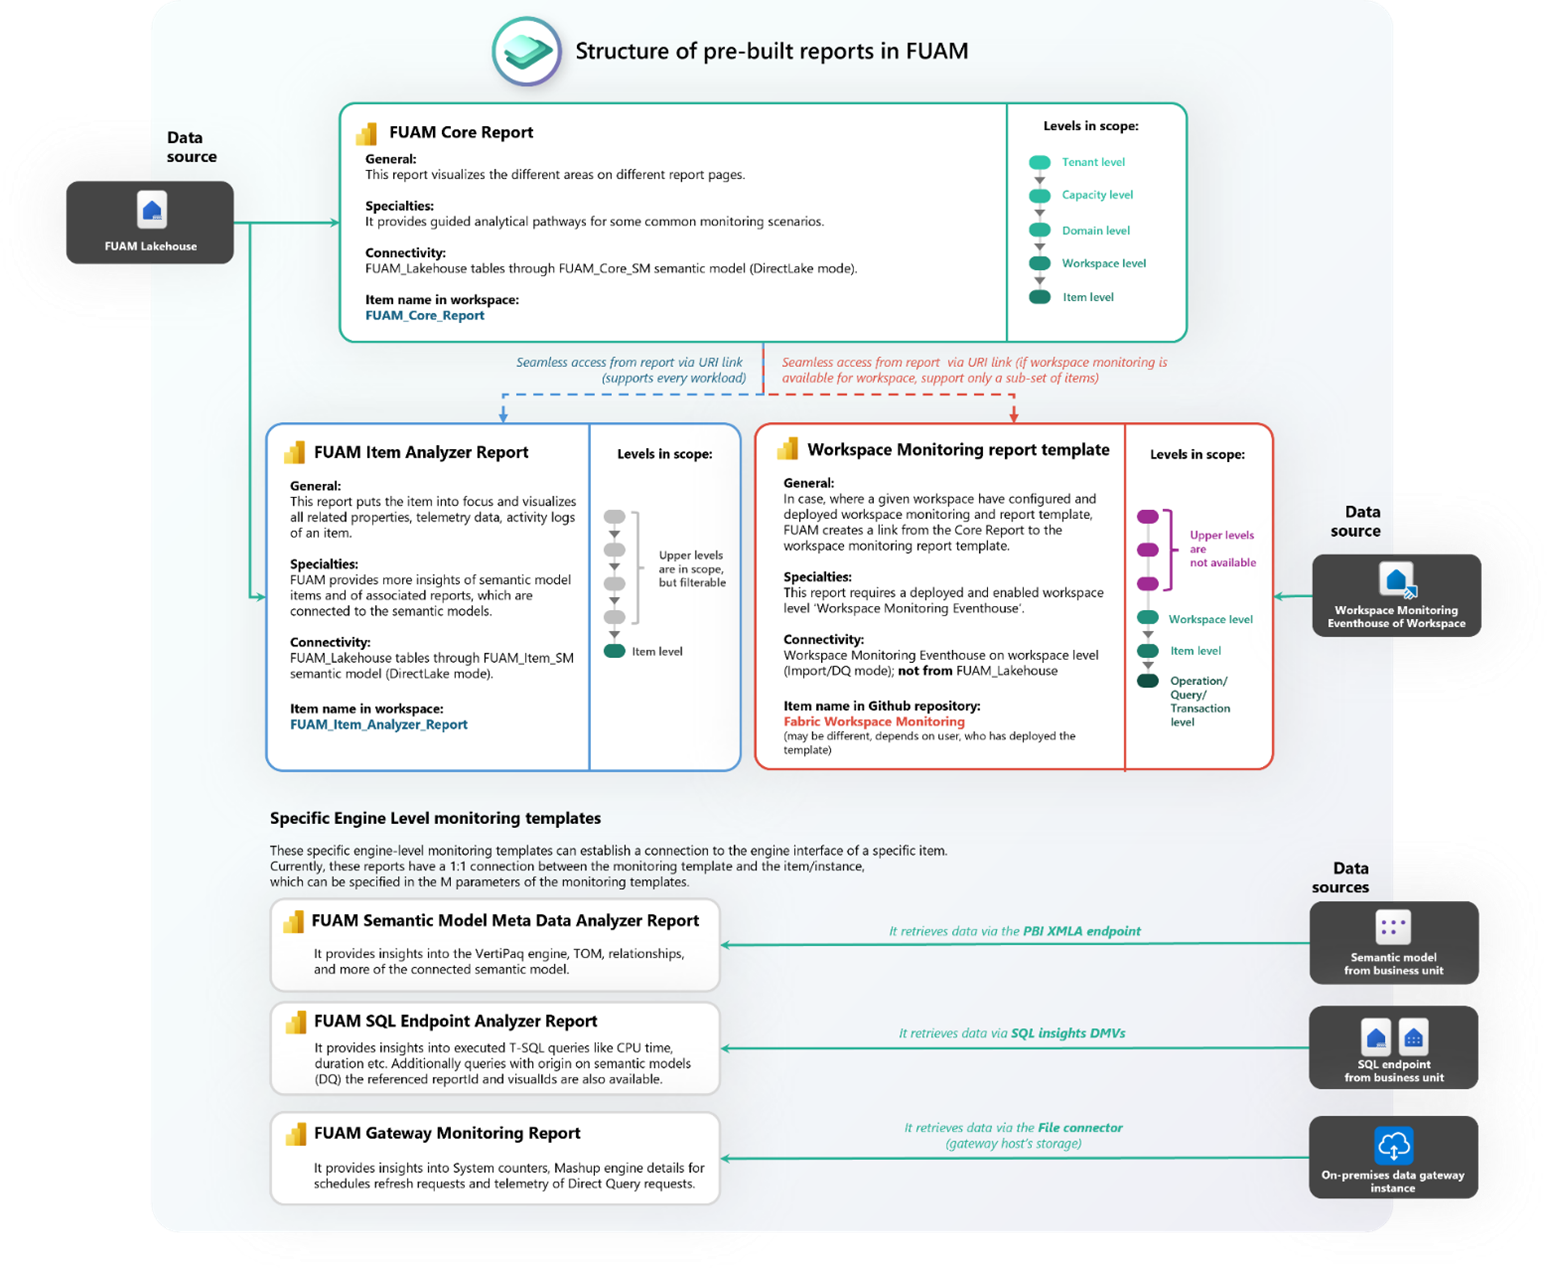
At the centre of FUAM’s reporting layer is the Core Report, the main entry point for tenant activity, capacity usage, and governance settings. From here, admins can drill down from tenant-wide views to individual workspaces. For deeper analysis, the Item Analyser Report allows admins to zoom in on datasets, reports, or semantic models. It highlights telemetry data, activity logs, and other metrics often hidden in standard dashboards. Together, these two reports provide a strong balance between high-level visibility and detailed investigation.
Workspace Monitoring
For workspace-specific needs, FUAM offers a Workspace Monitoring template. Unlike the Core and Item Analyser, this report connects directly to the Workspace Monitoring Eventhouse, making it useful for analysing query behaviour, refresh activity, or workspace-level configurations.
Engine-Level Insights
FUAM also introduces templates for deeper, engine-level monitoring:
– Semantic Model Metadata Analysis:
explores the VertiPaq storage, relationships, and semantic model structures (via the XMLA Endpoint).
– SQL Endpoint Analysis:
surfaces query performance, CPU usage, and execution patterns for DirectQuery and T-SQL workloads (via SQL DMVs).
– Gateway Monitoring:
captures diagnostics from on-premises gateways, including refresh and DirectQuery requests (via File connector).
These reports extend FUAM’s scope from broad tenant oversight to the mechanics of Fabric workloads. The official diagram below illustrates how these reports are structured within FUAM and how they connect to the underlying data sources:
And here is an example of how the homepage on the Core Report looks like:
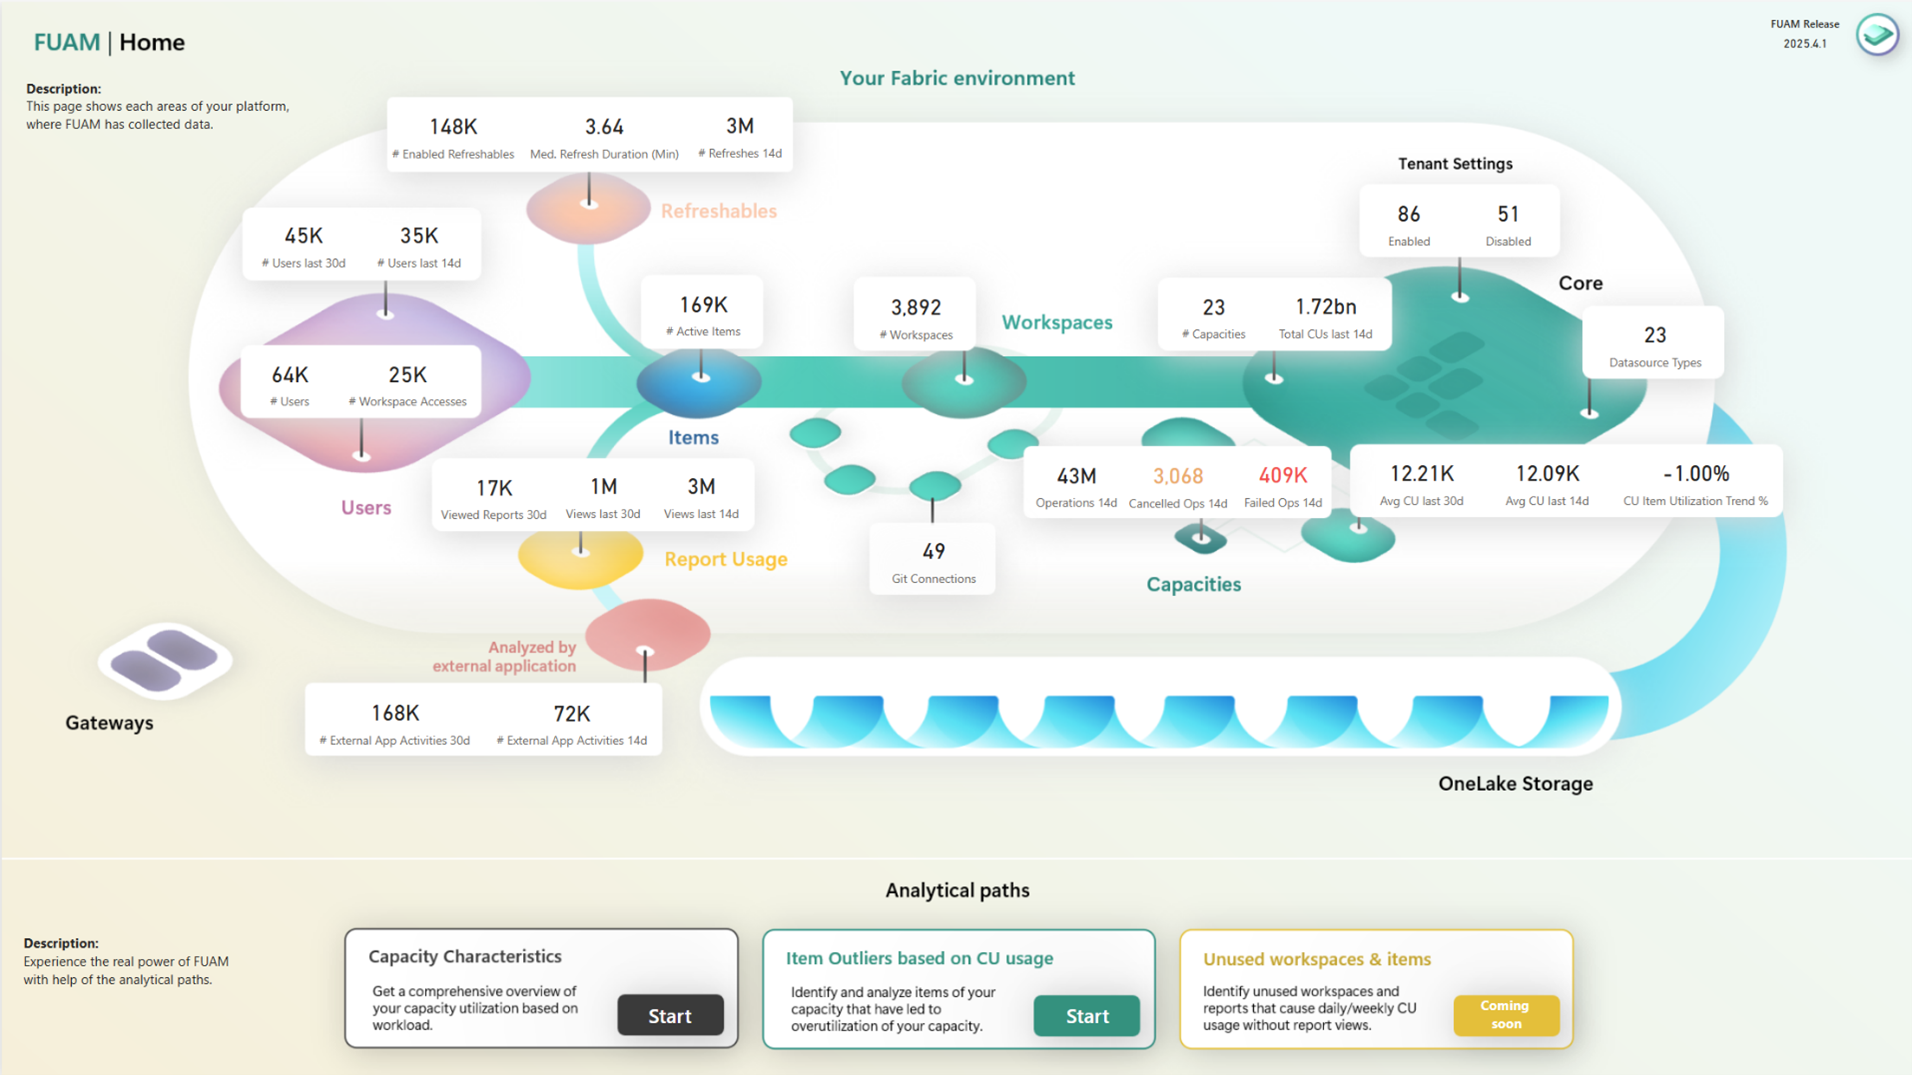
Source: FUAM GitHub
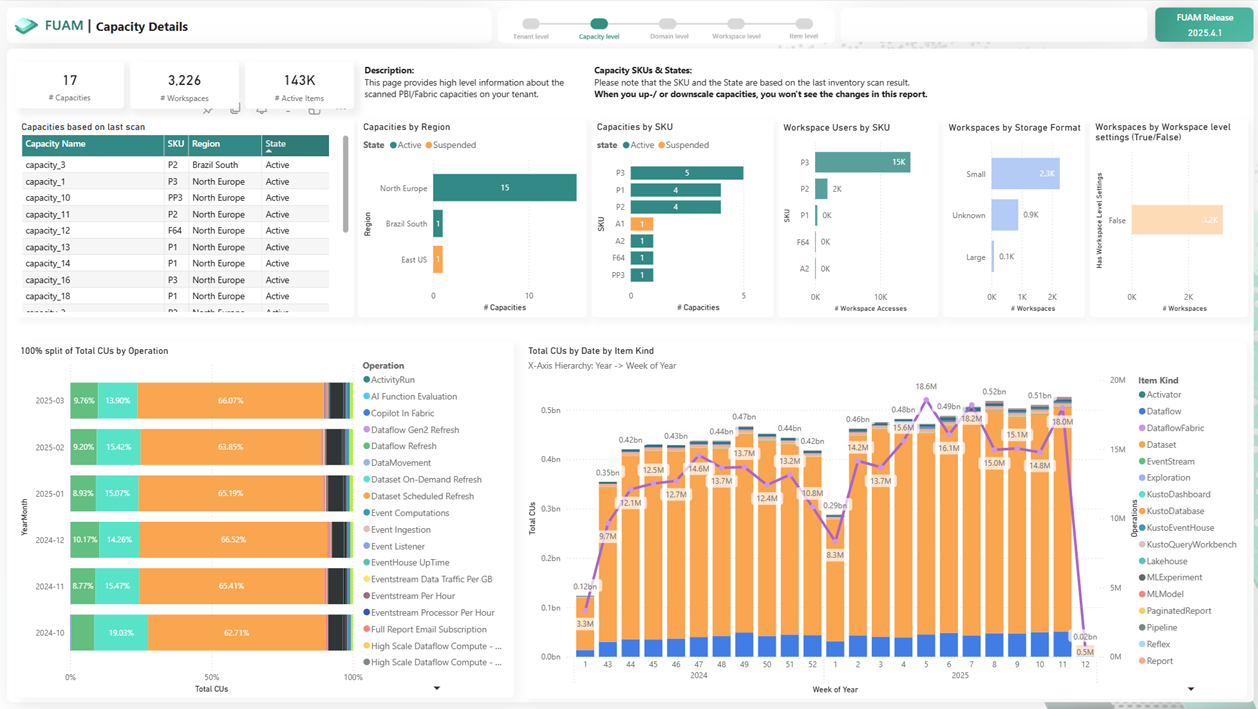
Here’s another example, this time focusing on Capacities:
We’ve explored how FUAM collects and organises tenant data, and how its pre-built reports turn that data into actionable insights for administrators. In Part III, we’ll dive into the solution’s limitations, the effort required to maintain and customise it and best practices for deploying FUAM effectively in your organisation. Interested? Click the link to read more.
Source: FUAM GitHub