What is Data Wrangler?
A key selling point of Microsoft Fabric is the Data Science experience. This experience provides data scientists and Fabric users with capabilities to build and monitor machine learning models in the Fabric web environment. The aim is to seamlessly enrich your data with predictions and uncover new insights.
A crucial stage in the data science process is preparing data for machine learning. In fact, it is often stated that 80% of a data scientist’s time is spent grappling with data in the cleansing stage. This can include generic data cleaning tasks, such as replacing missing values, selecting columns, enforcing data types, tidying up string columns, and so on. Or, it can include more specific machine learning tasks, such as one hot encoding, feature scaling and feature engineering.
Data Wrangler is a tool within Fabric to help with the job of cleaning, preparing and pre-processing – or wrangling, if you will – data for machine learning. It is a graphical user interface (GUI) that generates the Python code required for the task and integrates the code into a Spark notebook.
At the time of writing, the Data Wrangler currently supports the following operations:
| Operation | Description |
| Sort | Sort a column in ascending or descending order |
| Filter | Filter rows based on one or more conditions |
| One-hot encode | Create new columns for each unique value in an existing column, indicating the presence or absence of those values per row |
| One-hot encode with delimiter | Split and one-hot encode categorical data using a delimiter |
| Change column type | Change the data type of a column |
| Drop column | Delete one or more columns |
| Select column | Choose one or more columns to keep, and delete the rest |
| Rename column | Rename a column |
| Drop missing values | Remove rows with missing values |
| Drop duplicate rows | Drop all rows that have duplicate values in one or more columns |
| Fill missing values | Replace cells with missing values with a new value |
| Find and replace | Replace cells with an exact matching pattern |
| Group by column and aggregate | Group by column values and aggregate results |
| Strip whitespace | Remove whitespace from the beginning and end of text |
| Split text | Split a column into several columns based on a user-defined delimiter |
| Convert text to lowercase | Convert text to lowercase |
| Convert text to uppercase | Convert text to UPPERCASE |
| Scale min/max values | Scale a numerical column between a minimum and maximum value |
| Flash Fill | Automatically create a new column based on examples derived from an existing column |
Why do we need Data Wrangler?
It takes a long time to learn how to code. It can be challenging even for experienced developers to remember functions and syntax off-the-cuff without the help of Google or, nowadays, ChatGPT. Consequently, we are seeing an increase in low code or no code tools that reduce the barriers to entry for those trying to learn and progress in the tech? industry.
Data Wrangler follows suit by providing a simple-to-use interface for data pre-processing. This simplifies the data science process and enables more time for training and evaluating models, rather than the grunt work of cleansing and preparing data.
However, those familiar with Power BI may wonder why it is needed, as we already have a Microsoft GUI for cleaning and transforming data – the Power Query Editor. Although there are currently similarities between the two they are different tools that do different jobs for different purposes.
The Power Query Editor is an ETL (Extract, Transform, Load) tool primarily to prepare data for reporting; Data Wrangler is a tool specifically for data scientists to prepare data for machine learning. The Power Query Editor generates M code that is rarely modified; Data Wrangler generates Python code that can be easily copied and edited.
How do you use Data Wrangler?
To use Data Wrangler in Fabric, ensure you have the Data Science Fabric experience selected and a notebook open. Read in your data from a lakehouse into a Spark or Pandas DataFrame, select Data Wrangler in the Home ribbon, then click on your loaded DataFrame.
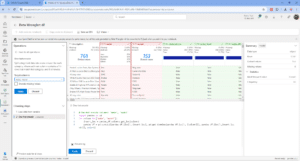
Data Wrangler then appears so that you can begin wrangling your data! The user interface is made up of seven elements:

- Data View – this provides a preview of the data in the DataFrame.
- Column Statistics – this provides a high-level summary of each column, including the distinct values, missing values and column distributions.
- Summary – this provides a more detailed summary of each column selected, including the most frequent value, the mean and median, the standard deviation, the skew and kurtosis.
- Operations – this is the list of transformations or operations that can be applied, categorised into find and replace, format, formulas, numeric, schema, and sort and filter.
- Cleansing steps – this displays the list of operations applied to the data, with the ability to remove steps and return to previous steps.
- Code preview – this displays a preview of the code generated for the operation.
- Toolbar – this provides options to copy code to clipboard, add code to notebook as a function, or save DataFrame to a csv file.
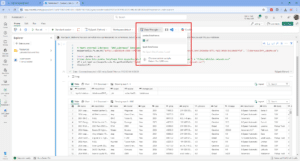
To use the tool, simply select the operation you want to apply from the list of operations, fill in the required details, such as the target column, then hit apply. As you can see in the example below, a preview of the code generated is displayed, along with the outcome of the operation.
After applying all your intended steps, add the code to your notebook, and then you have finished using the Data Wrangler. You can use the Data Wrangler multiple times within the same notebook, however, each time you launch the Data Wrangler it won’t remember previously applied steps, a new set of operations will get applied.
The Verdict?
To conclude, Data Wrangler is a useful and interesting tool that can support data scientists in the machine learning process. By autogenerating code, it saves a significant amount of time in the data preparation process, unlocking more time to focus on the modelling stage, where data scientists can add the most value.
The way that the tool previews the outcome of operations is a nice feature, along with other features it has borrowed from Power Query Editor, such as applied steps, splitting, grouping and aggregating data. The list of operations should cover most of your basic needs, however, it would be nice to see more operations borrowed from Azure Machine Learning designer, such as splitting data, joining data, SMOTE, and other operations to support feature engineering.
As it is very new tool, it does have its limitations. I experienced the occasional error message “Data Wrangler import code failed” when launching the tool. Furthermore, there were some user interface defects, such as values appearing too large from the drop downs, and sluggish performance due to loading of previews. Although the new ‘column by example’ feature is present, it is almost unusable, which is disappointing as it is one of my favourite features of Power Query Editor.
Despite these shortcomings, it is a mostly positive experience using the tool. I hope Microsoft continues to improve the Data Wrangler as it has potential to be a winner with Fabric data scientists.