Master Data Services tables such as the staging tables have been well blogged and documented, but there are a host of other system tables and views that can help you with an MDM project. By querying this tables and views, we can gather MDS metrics such as the number of members, number of validation errors and staging errors, all of which can then be exposed to a data steward via a dashboard. Given all of the recent updates around Power BI, I decided to use Power BI Desktop in order to build an MDM dashboard for this blog post. The goal in this case is to produce a dashboard that allows a data steward to get an overview of metrics on an MDS model by model basis.
Power BI Desktop
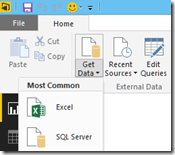
The first step when working with Power BI is to import some data. Once we start Power BI Desktop the welcome screen gives you a shortcut to get data, or we can do this via the ribbon:
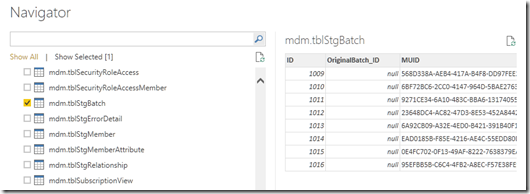
In this case we need to take data from SQL Server, so clicking the SQL Server option requires us to enter a server name and optionally a database name. Once we do this and pick the MDS database, we get a list of tables choose from:
Clicking on Load will load the tables into Power BI.
Master Data Services Objects
The question is what tables do we need? If you navigate the MDS database you will see that there is a mix of Master Data tables (e.g. post-fixed with _EN for entity), application tables and metadata views (prefixed with viw_SYSTEM). Its the system views that we need to start with, as we want to allow a breakdown by model, entity and version. To do this we need to load in the following views:
--Models
SELECT          ID AS ModelId, Name AS ModelName
FROM            MDM.viw_SYSTEM_SCHEMA_MODEL

--Entities
SELECT          E.Id AS EntityId, E.Name AS EntityName, E.Model_ID, e.Model_Name, E.Model_MUID
FROM            MDM.viw_SYSTEM_SCHEMA_ENTITY E

--Get a count of versions
--This is used as a total and by version status
SELECT      V.ID AS VersionId, V.Name AS VersionName, V.Model_MUID, V.Model_Name, V.Status AS VersionStatus
FROM        [mdm].[viw_SYSTEM_SCHEMA_VERSION] V
Next it would be useful to report on the member count in each entity. This is a little harder as its not stored in the metadata tables, but we can combine the MDS metadata views with the SQL Server sys.dm_db_partition_stats Dynamic Management View in order to return the row counts per member:
--This gives the row count per entity for all models
SELECT          E.Name AS EntityName, M.Name AS ModelName, M.MUID, M.ID AS ModelId,
                'mdm.' + E.EntityTable AS TableName, P.row_count
FROM            MDM.viw_SYSTEM_SCHEMA_ENTITY E
INNER JOIN      MDM.viw_SYSTEM_SCHEMA_MODEL M ON M.MUID = E.Model_MUID
INNER JOIN      sys.dm_db_partition_stats P on P.object_id = OBJECT_ID('mdm.' + e.EntityTable)
AND             P.index_id = 1
Finally a few more metrics that would be useful are the number of staging errors and a breakdown of the members by validation status (Validation Succeeded, Validation Failed, Awaiting Validation). To do this we can take in the following tables and stored procedures:
--Get the current count of errors that have occured during staging
SELECT    Entity_ID AS EntityId, ErrorMemberCount, Version_ID
FROM    mdm.tblStgBatch

--Pass in the appropriate version id
EXEC [mdm].[udpValidationStatusSummaryGet]
--This gets the validation issues by model/entity:
SELECT    ValidationIssue_ID, Version_ID, Model_ID, ModelName,
        Entity_ID AS EntityId, EntityName, Member_ID, BusinessRuleName
FROM    [mdm].[viw_SYSTEM_USER_VALIDATION]
Power BI Relationships and Visualisations
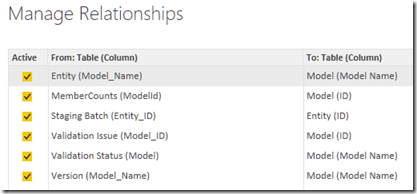
Once we import the data, Power BI Desktop will detect relationships automatically for us, but can alter them by clicking on Manage Relationships on the ribbon if we wish. The following shows the relationships between the various MDS objects mentioned above:
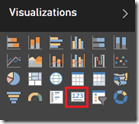
Once we’re happy with the model and the relationships, then we need to start dragging and dropping to build the Power BI report. As an example we can create a simple card visualisation to show the count of various metrics:
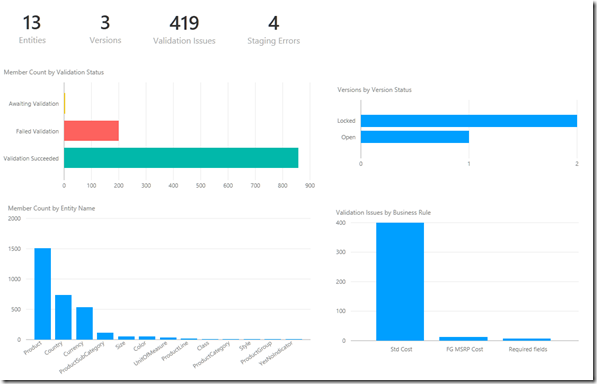
This can be used to produce the following metrics, the count of entities, versions, validation issues and staging errors:
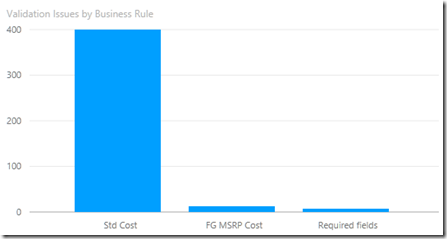
Equally we can create a simple column chart by using the [mdm].[viw_SYSTEM_USER_VALIDATION] view. The count of issues is the Value section of the chart, whereas the Business Rule Name is on the Axis:
Putting it all together we can get the following report, shown for the sample Product model:
Conclusion
This is just a start, there are other metrics that you could put onto an MDM dashboard – as an example you could include MDM ETL metrics if you’ve logged them. But overall the combination of the rich MDS metadata and intuitive Power BI interface means its relatively easy to produce simple dashboards.

