This is the final part of a three-part series of blogs where I look at Copilot for Power BI. This part gives an overview of what is available for Power BI developers, the first part gives a general overview, and the second part looks at Copilot for business users.


TLDR –Some of the Copilots aimed at Power BI report developers are useful, while others still need work. If you have access, I recommend looking at them individually to see if you want to use them in your organisation and then developing a plan for deploying them.


The many Copilots of Power BI


I want to see if using the Copilots would increase productivity. I’ve tried to consider each from a range of perspectives and test it with a range of different datasets. The perspectives I’ve considered for the desktop are, someone who is new to Power BI and a more experienced user.

Writing DAX

The DAX query view has Copilot support which allows you to ask it to “Suggest Measures”, “Explain a DAX topic” or get it to “write a DAX query”. While I could not get it to “Suggest” a measure that was useful both the Explain DAX and Write DAX query functionality work well. It allowed me to write measures more efficiently, you can also edit the measures it suggests and can easily add the results into your model.


As with all AI tools designed to support coding, they deliver the most benefit to those with experience. They can effectively ask what they are looking to achieve, understand if the suggested code is correct and debug it if it is wrong. It would certainly allow someone with no or limited DAX knowledge to write DAX, but they could create a model full of measures returning the wrong values.


Some scenarios I tested

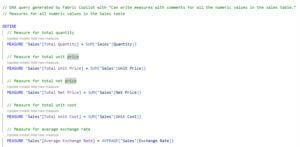
  1. “Can you write measures with comments for all the numeric values in the sales table”
    This returned a good set of measures and given that you often need to create these base measures as a first step this would be a time saver. It even decided to average the exchange
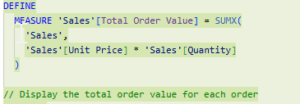
  2. “Based on unit price and total quantity could you create a measure with comments that shows the total value of each order”?

    I got the right answer. This is a good example where DAX knowledge helps, I knew it would need an iterator function so suggested it did it by order. When I asked it “could you write a measure to multiply total unit price by total quantity” I got what would be the wrong answer
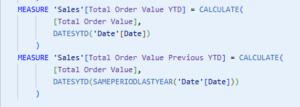
  3. Based on Total Order value could you create measures that sum this up for the year to date and one to compare it to the previous year”. The output was what I wanted.
  4. “Could you also add measures to show the year-on-year change as an actual figure and a %”. The output was what I wanted
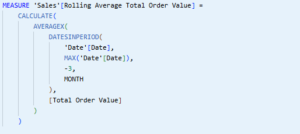
  5. “Can you create a measure with comments for the rolling average of total order value based on the previous 3 months”

    Here I struggled to find the prompt to get the answer I wanted, this measure gives the average daily total for the last 3 months, which might be a legitimate answer to the question, but I wanted the rolling average of the monthly total. For my next attempt it created a month to date total and then averaged the MTD for each day for three months. After a few attempts I got the correct measure, but it was not easy.


Conclusion

Using it will save me time and I will use it if it is available. If you are using ChatGPT to help with DAX this is certainly a valid alternative if you have access. It is not a substitute for learning DAX, although the ability to explain topics can help with this. If you are new to DAX, my advice when using it would be to test the measures and if it suggests a function you are not familiar with, or an expression you don’t understand spend some time to understand it.

Measure Descriptions

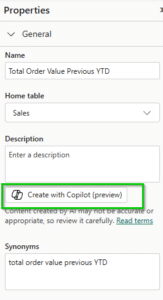
In the model view there is a button that will ask Copilot to generate a measure description. Measure descriptions are one of the things that should be populated in the model but often they aren’t. They make it easier for users of the model to understand the measures and the users include the various other copilots. To access the feature, go to the model view and select a measure and an option will be available in the Properties pane.

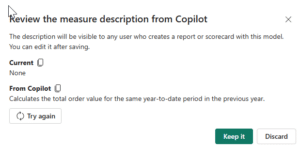
When you click, it will generate a preview of the measure descriptions which you can choose to keep or discard. If you keep it, you can edit it.

Conclusion

From my testing, it returns reasonable descriptions. Even if I needed to edit them this would save me time by either fully or partially completing the descriptions. Obviously if you have column names that don’t make sense the descriptions may not make sense. The more complex the DAX the more likely you are to need to edit the final description. My main frustration with this feature is you need to do it measure by measure rather than having the option to do all the measures at once. It would also be useful to have something similar for columns, tables and synonyms.

Enhance Q&A with Copilot for Power BI

Copilot generates extra synonyms for the QA visual, in addition to the ones the QA visual already generates.

Conclusion

This is currently only for the Q&A visual which seems like a wasted opportunity, it would be great if once it has generated the synonyms it added them into the model. However, if I was using the QA visual, I would use this to generate some extra synonyms.

Report Creation 

The ability to create reports is available in the desktop and there is a similar feature in the Service called “Explore this data” which allows the auto creation of a report. The desktop version generates a report page, it will suggest possible topics based on the semantic model or you can suggest the area you would like it to focus on. It will then add a background, title and some visuals based on this.  


You can also ask for specific charts that you add to the page which is probably a more reliable and effective than creating a whole page. It can still require a few prompts to get the chart type you want with the fields you want, and this obviously requires you to know the model and it is probably still quicker to drag and drop rather than type the prompt. 


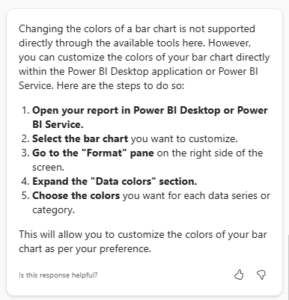
The biggest challenge is your ability to edit whatever is created with Copilot is non-existent. Want to change colours, axis, titles or formatting? Copilot can’t do it. It will give you instructions on how to do it which could be useful but this is a big limitation. 

Conclusion 

I would not currently use this as I would spend more time typing in the prompts and then editing the outputs into a form I wanted than doing it using the drag and drop interface. If it was a user unfamiliar with the Power BI interface, I’m still not sure I would recommend the copilot for creating content over the drag and drop interface. I think it could be helpful if you wanted to know how to format aspects of a chart as it will give step by step instructions on how to do different things. This is the weakest of the copilots and is well behind some of the other generative AI tools that do this better. 


Overall Conclusion

There are some of the Copilots for developers that I would use if available including the DAX editor, measure descriptions and QA synonyms, they would increase my and other developers’ productivity. The DAX Copilot like other coding copilots helps those with experience more than those without, and works better with models that follow best practice which again favours the experienced developer. The report creation copilot at this stage is not one that works well enough for me to see myself or anyone else using it.


Do you want help using or deploying Copilot with Power BI? If so, please reach out and we can share our experience with the different Copilots and getting the most benefits from them.