The exponential growth of Large Language Models (LLMs) couples with Microsoft’s close partnership with OpenAI to mean that the integration of Copilot into Microsoft Fabric is of no surprise. Specifically, Microsoft Fabric markets a “next generation of AI”, with Copilot’s generative capabilities applied across Fabric’s core tenants from Power BI to Data Factory. Whilst the generative abilities of Copilot are well-documented, the application of these abilities to programming notebooks is not. In that context, this blog will explore the application of GitHub CoPilot with Microsoft Fabric, specifically detailing the ways in which Copilot can improve your notebook development experience within Microsoft Fabric.
Functionalities of Microsoft Fabric and Copilot
To begin with, it’s worth a brief recap on the actual features of Microsoft Fabric. Launched in mid-2023, Fabric integrates features on data warehousing, data science, data quality into an end-to-end analytics solution. Scalability, efficiency, and ease-of-collaboration are just some of the benefits, with Copilot functionality found across Power BI, Data Science, and Data Engineering features.
To explore the Copilot functionality for data science, start by accessing the Notebooks feature of the Data Science section from the Fabric dashboard, before creating a new notebook. Accessing Copilot from this point requires either Visual Studio Code or an SKU at F64 or above. For the purposes of this demonstration, we will be using the former option.
Select the “Open in VS Code” tab of the Notebook toolbar and open a new project in Visual Studio Code using the instance of the specific Fabric notebook. Once there, head to the Extensions widget of Visual Studio Code, install Copilot, and establish that Copilot is connected to your GitHub account. With the Status icon indicating “Ready”, we can now explore Fabric’s Copilot data science functionality in Notebook format.
Figure 1 – Copilot Readiness
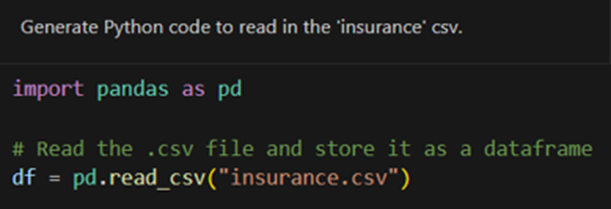
The dataset used for this demonstration is that of an open-source insurance premium dataset provided by Kaggle that can be found here. With it stored in our working directory, we’re going to read it in with the help of Copilot (Figure 2).
Figure 2 – Data Load
With the data now read in, we’re going to complete two staple tasks of ‘traditional’ data analyst work; data cleaning and descriptive statistics (in that order). In the first case, we’re going to change the format of string variables to integers (for ease-of-analysis purposes). As shown by the output of Figure 3, Copilot handles this with ease.
Figure 3 – Data Wrangling
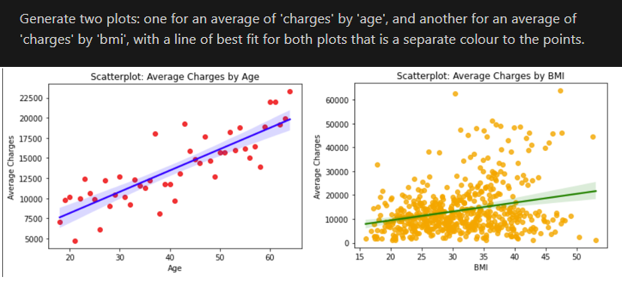
Figure 4 – Data Visualisation
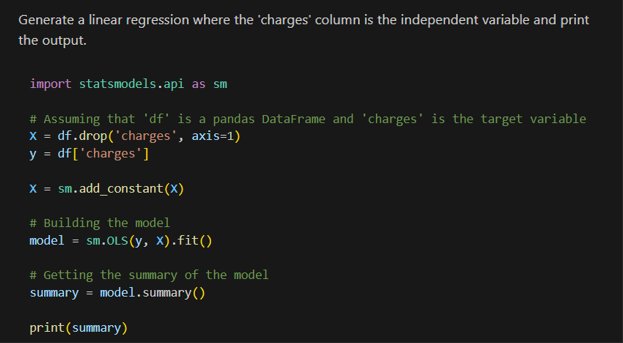
The plots mentioned above are produced with a similar ease, as shown by Figure 4. If it’s not already clear, much of what was deemed “bread and butter” data analyst work several years ago is very comprehensively within Copilot’s capabilities. Said capabilities are not limited to descriptive statistics and data wrangling; the linear regression shown below was quickly and accurately produced by Copilot. It’s also worth noting that all code within this demonstration compiled on the first attempt.
Figure 5 – Linear Regression
Summary
Having demonstrated the overwhelming productivity benefits that come with Fabric’s Copilot, it’s worth noting that contextual understanding of code is comparatively less effective for Copilot than it’s accurate, fast generative capabilities. However, the specific issue of contextual understanding is not specific to Copilot but rather LLMs in general. It also does not outweigh the overwhelming producitivity benefits offered by Fabric’s Copilot. Fundamentally, Copilot is quickly and competently able to complete tasks that, four to five years ago, could fairly be described to comprise the bedrock of data analyst work. This is demonstrative of the way that generative LLMs within Fabric have and will continue to positively impact the nature of data science work.


