Creating a Data Dictionary in Power BI


Creating a Data Dictionary in Power BI
A common requirement for Power BI reports is for them to include a “Data Dictionary” or “Definitions” page that explains what tables and columns are in the model, where the data comes from and how the measures are calculated. This is also something that analysts regularly add into reports to reduce the number of questions they have to answer about the reports.
There are various ways of doing this that I’ve seen but in the October 2024 Power BI update four new INFO.VIEW DAX functions were added that allow Power BI report authors to easily include information on tables, columns, relationships and measures in the report. As these create tables that are part of the Power BI semantic model this also means that when new measures or tables are added the “dictionary” will reflect this when the model is refreshed.
The DAX Functions
The four new DAX functions are
1) INFO.VIEW.TABLES()
2) INFO.VIEW.COLUMNS()
4) INFO.VIEW.RELATIONSHIPS()
4) INFO.VIEW.MEASURES()
The INFO.VIEW functions are views on top of the INFO functions that were added as part of the DAX Query view to allow access to the Schema DMV’s that you might have accessed using tools like DAX Studio.
Step 1
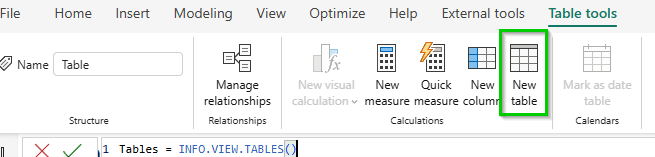
To add them to the model, go to the “modelling” tab in Power BI desktop, select “New Table” give the table a name and add the relevant function.
Step 2
This will add a table to the model with information on the Tables, Columns, Measures or relationships in the model.

Step 3
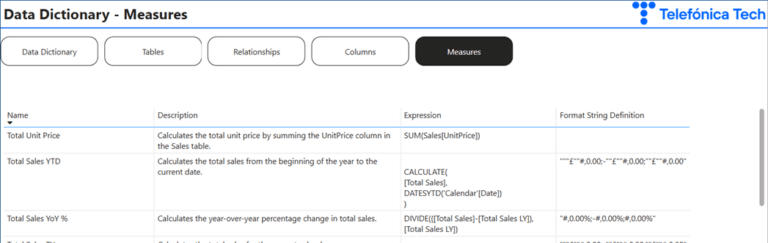
The information in the tables is different for each of the functions but critically for Tables, Columns and Measures it includes the description. These tables can easily be used to create a data dictionary in your report giving the user more detailed information.
Challenges
Missing Descriptions
For this to work the descriptions for tables, column and measures need to be populated. Populating the descriptions is good practice, but I see more models without them, than with them. The descriptions can be entered in the Model view or using a tool like Tabular Editor. When populating them think about what information will be useful to your users rather than just repeating the objects name, for example the source of the data in a table or expected values in a column.
Alternatives to Co-Pilot in Power BI
If you have access to Co-Pilot in Power BI there is a preview feature which will automatically generate the descriptions for Measures (it is not available for tables or columns). From my testing this works relatively well, although as with all content generated this way the results will need to be checked.
Separate Semantic Models and Reports
Many organisations separate out semantic models from reports and have many reports connecting to a single model. In this case you can add INFO.VIEW in the model and create a “Data Dictionary” report that covers all the content built from the model, that can be included in any Apps. You can’t use the functions in a report that has been Live Connected to the model and any measures added into the report rather than the central model will not be picked up.
Creating a Dictionary for all the Reports in a Tenant
This approach works for individual reports and models but if you are looking to understand and create a dictionary for your entire tenant this is where a tool like Microsoft Purview becomes relevant,