Databricks Genie allows users to query data using natural language within Genie Spaces, making it easier for non-technical users to explore data. As adoption grows, monitoring usage, performance, and engagement in Databricks Genie Spaces becomes increasingly important.


In a Genie space, users with ‘CAN_MANAGE’ permissions can head over to the Monitoring section of a Genie room to see user interactions and the questions being asked. While this is a great starting point, it can be tough to spot common trends, identify potential issues, or get a clear sense of how often users are actually engaging with Databricks Genie. Currently, you’d have to manually sift through every question and summarise them yourself, a daunting task in a busy environment with many users.


In this post, I’ll share a solution that organises Databricks Genie monitoring data into a clean and easy to read dashboard. We’ll walk through how to gather the monitoring info, process it through Bronze, Silver, and Gold layers, and present the final insights to your users.

Data Sources for Databricks Genie Monitoring

The information we need can be found in a few different places:


  1. Genie API Calls – used to fetch conversations, message indexes, and specific message content from Databricks Genie Spaces.
  2. System Access Audit Logs – system.access.audit table records detailed events across your Databricks workspace. To focus on Genie activity, we extract records where service_name = ‘aibiGenie’. A list of actions logged into this table and their meanings can be found here.
  3. System Query History – system.query.history tracks every SQL statement run via SQL warehouses. We’ll filter for queries originating from Genie spaces by looking for client_application = ‘Databricks SQL Genie Space’. This is particularly helpful for tracking Databricks Genie query performance as usage grows.

The Bronze Layer for Databricks Genie Data

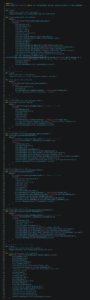
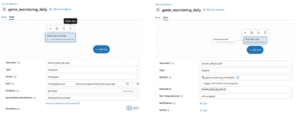
To get started, we’ll use a notebook to gather our data from Databricks Genie APIs.

How to Monitor and Optimise Databricks Genie Spaces with a Custom Dashboard - 1


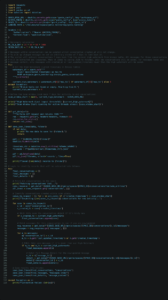
The process involves first extracting the conversation IDs, then looping through them to grab the associated messages and content. Since the Conversations API doesn’t currently support server-side filtering, the call will return everything. To keep things efficient, we’ll add some custom logic to check our existing Bronze table and only process new records.


All extracted data will be stored in Databricks Volumes. Let’s start by making sure those volumes are set up:

How to Monitor and Optimise Databricks Genie Spaces with a Custom Dashboard - 2


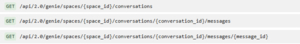
Next, we’ll extract the conversations and use the conversation_id to loop through all the associated messages.


It’s important to remember that a single conversation can contain multiple messages, and these can be added at different times, for example, when a user revisits a conversation via the Monitoring section in the UI to ask a follow up question. To ensure we capture these updates or newly created messages, I’ve implemented a seven day “look-back” window. This ensures recent Databricks Genie interactions are always included.


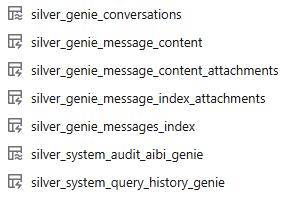
We now have new conversations and messages within these conversations placed into 3 volumes:


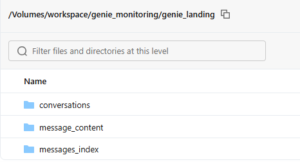
This is our landing area for data from Genie APIs. From here it will be ingested into bronze layer. For conversations/message index/message content datasets I am using dlt.apply_changes to handle Change Data Capture as these extracts might contain updates to existing records. This function handles merging new data into target table.


System.query.history data ingestion is also using this function as records in this table can be updated.


System.access.audit is append only table and append-only stream is appropriate here. It will also ensure better performance, too.


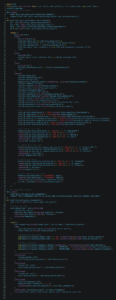
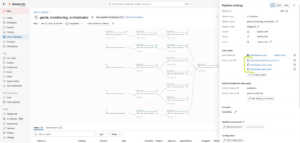
Let’s move our data to bronze layer:


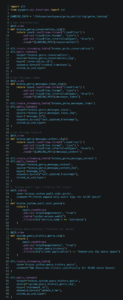
This code defines our bronze layer and consolidates Genie monitoring data from two distinct paths: API-driven JSON extracts stored in Volumes and Databricks system tables. By using a mix of CDC (Change Data Capture) for conversation updates and efficient streaming for audit logs, we create a clean, deduplicated foundation for all our downstream monitoring.


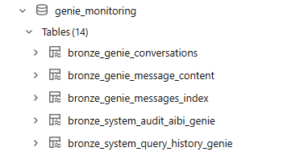
skipChangeCommits is applied to the system tables to make the ingestion more robust. It prevents the pipeline from unnecessarily reprocessing data when these system tables undergo background maintenance or optimization.


inferColumnTypes is used by Auto Loader when streaming the JSON files and ensures that schema evolution works seamlessly, allowing new columns to be added automatically if the Genie API evolves over time.


This defines the Bronze layer and consolidates Databricks Genie monitoring data from API extracts and system tables, creating a clean foundation for downstream analysis


Silver Layer: Structuring Databricks Genie Data

In the Silver layer, our goal is to refine the raw data for easier analysis of Databricks Genie usage. We focus on flattening the nested JSON columns from the Bronze tables into a relational format and converting Unix timestamps into human-readable datetime formats.


The following code handles the unpacking and transformation of our Bronze tables into the Silver layer:


The messages_index and messages_content tables both include an attachments column. This field is a bit of a catch-all and contains various items, such as the user’s natural language query, the generated SQL, suggested follow-up questions, and Genie’s actual response.


Because a single message can and indeed does have multiple attachments, we store this data in its own dedicated tables. We’ve included keys that allow easily linking of  these attachments back to their original messages.


A particularly useful field within these attachments is the statement_id. This is the unique ID for the SQL query executed by Databricks Genie. By using this ID, we can join our Genie data with the system.query.history table. This allows us to tap into detailed performance metrics for every user interaction that resulted in a SQL query, giving us a clear view of how well the system is performing as it scales.

In Silver layer we now have these objects:

Gold Layer: Databricks Genie Insights

The Gold layer contains two tables designed for reporting on Databricks Genie performance and engagement:

Performance and Feedback

The Performance and Feedback table combines conversation and message data with SQL Warehouse metrics from system.query.history. This provides a unified view that makes it easy to identify performance bottlenecks or any degradation in response times as the system scales.


User Engagement

The User Engagement table tracks all actions performed within the Genie space. Since the system.access.audit logs capture every event, including background system operations, not every record represents a human interaction. To help with this, the Gold layer adds an interaction_source field (derived from the user_agent). This allows you to easily filter your reports to focus specifically on the user interactions.


Script to create Gold layer:

We now have 3 files with code that moves our data through medallion layers and can create a Lakeflow pipeline to orchestrate data processing by adding them as source files:


Create a Lakeflow job and schedule it for e.g. daily run by first adding a task to run the notebook to extract data from Genie APIs and then adding your genie_monitoring_orchestrator pipeline:


Gold layer tables bring all the data together, allowing us to present users with neatly organised insights through a dashboard containing tabs for user engagement and Genie performance:


By consolidating data into these two tables, we now have a versatile foundation for monitoring Genie spaces. We’ll be able to track user engagement, identify performance trends, and act on feedback – all in one place.


In fact, you could even consider adding these Gold tables into their own dedicated Genie space… though that might be getting a little too “meta”!

Final Thoughts on Databricks Genie Monitoring

By structuring your monitoring approach around Bronze, Silver, and Gold layers, you create a reliable way to track how Databricks Genie is being used across your organisation. This makes it easier to review performance, understand user behaviour, and maintain visibility as Genie Spaces scale.


As usage grows, having this level of insight becomes essential for keeping queries efficient and ensuring users get consistent results from Databricks Genie.

Related Resourses